ENEDI Overview
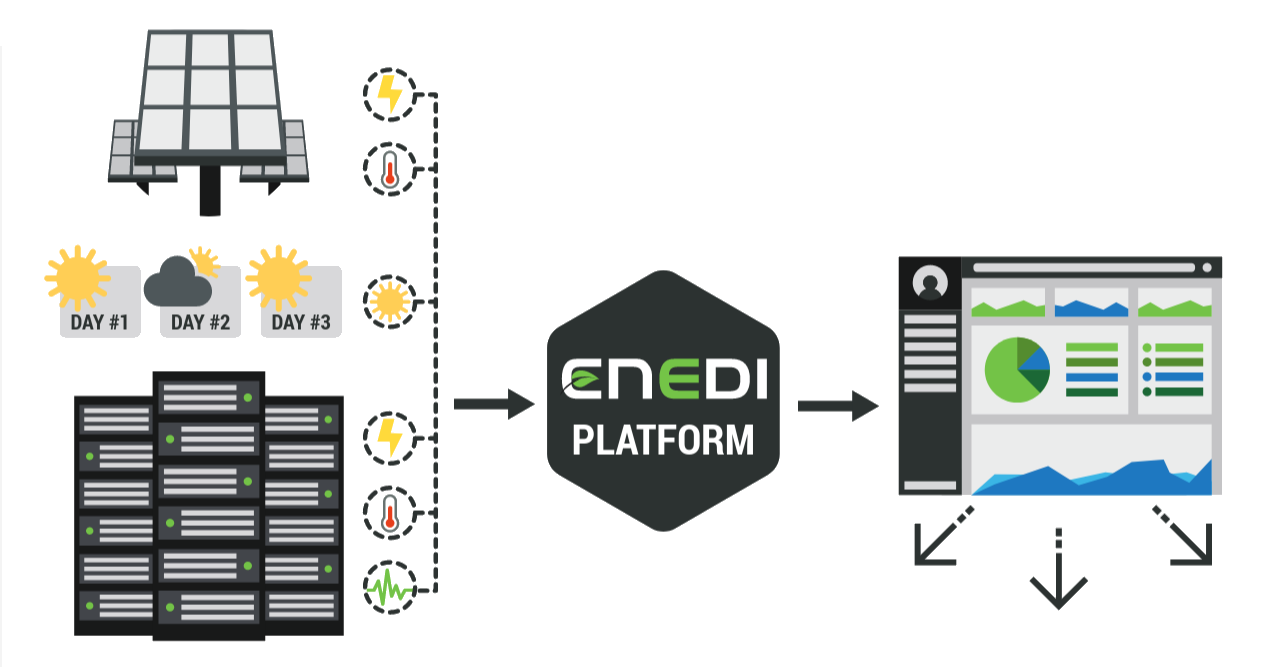
ENEDI is an integrated system that collects, integrates and analyzes data from Internet-of-Things (IoT) sensors, operating system, as well as, cloud middleware monitors, and open-data sources regarding: i) photovoltaic PV energy production in solar-powered datacenter facilities; ii) weather conditions; iii) power consumption by datacenter subsystems (clusters, cluster nodes, and cooling equipment), and iv) the time-evolving profiles of containerized cloud applications running on the datacenter.

ENEDI Features

Web-based responsive dashboard: aims to raise awareness regarding the impact of using renewable energy sources to power datacenters. Throughintuitive statistical visualizations of operational param-eters collected from the ENEDI monitoring system, the dashboard will highlight the positive effects of the ENEDI ecosystem in terms of cost and power efficiency.

Open-source monitoring probes: for the real-time collection of metrics originating from the PV vendor-specific data loggers. ENEDI allows to extract data from such closed-source devices through open-source probing interfaces, which could be integrated to other widely adopted monitoring systems.

Workload Management System for Geo-Distributed datacenters: with gathered data users are able to evaluate their deployments and design new strategies for dynamic resource provisioning and allocation across federated green datacenters offering public cloud services
ENEDI Architecture
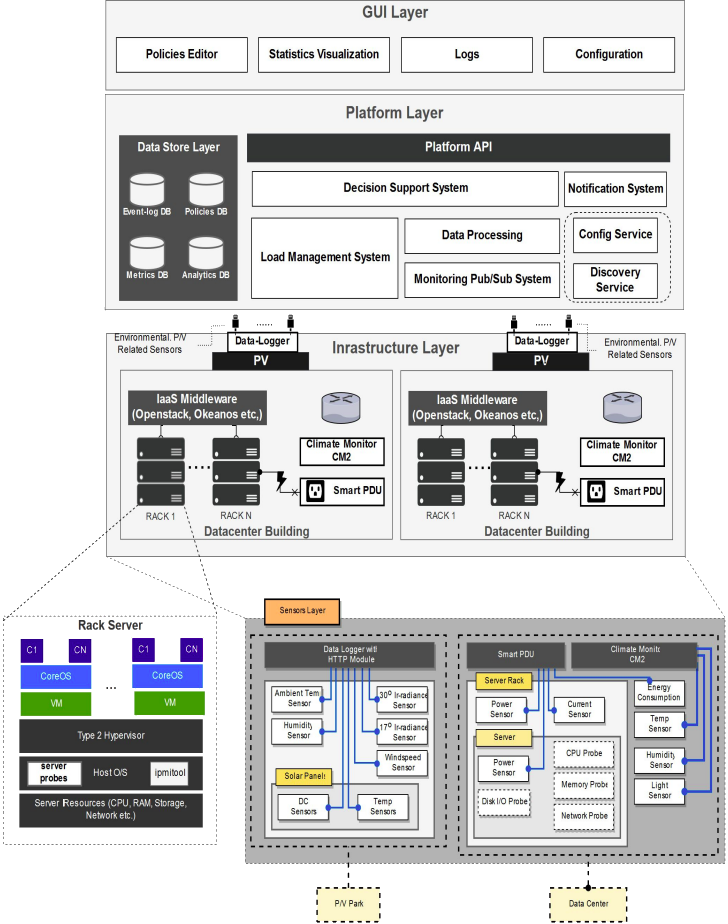
Enedi Architecture is divided into three layers: (i) Infrastructure Layer, (ii) Platform Layer, and (iii) GUI Layer.

Infrastructure Layer is the physical compartment that hosts all necessary computational equipment, such as bare-metal servers (processing units), storage, and various inter-connectivity devices, and peripherals, such as the power and cooling infrastructure, and various sensors that continuously measure performance, environmental and power production/consumption parameters.
Platform Layer is the responsible entity to facilitate the concept of Green computing, established via two fundamental processes: (a) Monitoring and (b) Analysis and Decision Making. The former collects fine-grained measurements from both, the underlying infrastructure and running applications, and stores them into a time-series database. The Analysis and Decision Making process digests the collected metrics, applies data analysis techniques by taking into consideration user-defined energy policies and by implementing state-of-the-art algorithms.
GUI Layer: is the graphical interface that enables end-users to interact with the underlying layers of the system. Specifically, users perform fine-grained configurations and tuning of the various ENEDI components, such as adjustment of monitoring frequency, the selection of the notifications and the definition of logging events among others. Furthermore, GUI provides both a policy editor that facilitates easy definition of the energy-policies and intuitive visualizations and plots that showcase real-time monitored data.